Advertisement analytics
This view shows you how your ads have performed over the selected time frame. This can help you evaluate which ads were successful as well as which issues occurred and with which frequency. You can filter the data on various parameters, such as Browser and Device type, which lets you compare the performance on different client configurations.
The data graph
The data graph shows, in absolute numbers, the following parameters:
- Ad requests - The number of ad requests initiated
- Ad plays - The number of requests that resulted in an ad getting played
- Errors - The number of requests that errored
- Skips - The number of ads that the user skipped
- Completes - The number of ads that the user watched to the end
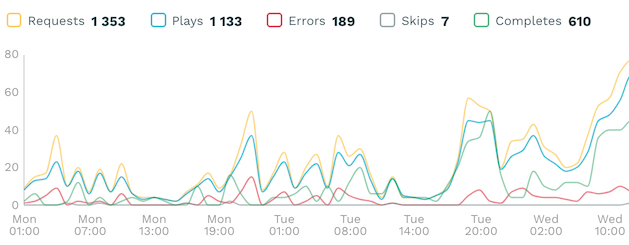
Hover over the graph to see the data for individual moments in time.
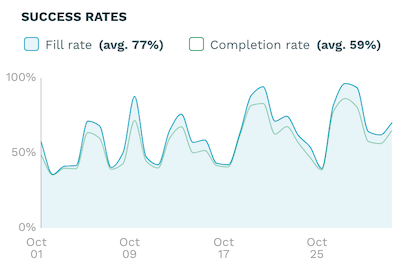
Success rate graph
The success rate graph shows the fill rate and completion rate. If you have filtered the data, the fill rate for unfiltered data will be displayed as a dashed line in the graph. This allows you to compare the filtered data to the overall trend and identify client configurations that perform better or worse.
Errors graph
The errors graph shows the error rate and occurrences of different VAST error codes. Within the graph, the different colors represent the different VAST error codes. Hover over the graph to see the error rate as well as a breakdown of the different VAST errors for individual moments in time. If you have filtered the data, the error rate for unfiltered data will be displayed as a dashed line in the graph. This allows you to compare the filtered data to the overall average in order to identify client configurations that are common sources of errors.

VAST errors table
This table lists all VAST errors that occurred in the selected time frame and the number of occurrences.
Analytics on ad tags
The analytics data for a specific ad tag can be viewed by selecting the tag in the Ad tags list. This view displays the ad tag specific data in the same graphs as the regular ad analytics view.